


No products in the cart.
HPLC Purity Percentage: 7 Powerful Reasons Two Reports Show Different Results
Table of Contents
- What Does HPLC Purity Percentage Actually Mean?
- Why Two HPLC Reports Can Show Different Purity Percentages
- 1. Different HPLC Columns Can Change the Result
- 2. Mobile Phase and Gradient Conditions Matter
- 3. Detection Wavelength Can Affect HPLC Purity Percentage
- 4. Integration Parameters Can Change the Reported Purity
- 5. Sample Preparation Can Produce Different Results
- 6. Different Reporting Criteria Can Produce Different Numbers
- 7. The Peptide May Actually Have Changed
- HPLC Purity Percentage vs. Actual Peptide Content
- A Practical COA Comparison Checklist
- Two Illustrative Peptide HPLC Case Studies
- How Experienced Researchers Should Read an HPLC Report
- Common Mistakes When Comparing HPLC Reports
- What a Strong Peptide COA Should Show
- Frequently Asked Questions
- Final Takeaway
What Does HPLC Purity Percentage Actually Mean?
HPLC purity percentage is one of the most frequently misunderstood numbers on a peptide Certificate of Analysis (COA).
A researcher may see one report showing 99.6% HPLC purity and another showing 98.4% HPLC purity for what appears to be the same peptide batch.
The immediate reaction is often:
“One laboratory must be wrong.”
That conclusion is not necessarily correct.
An HPLC purity percentage is the result of an analytical method and data-processing procedure. It is not simply an objective number that exists independently of the laboratory, instrument, chromatographic conditions, sample preparation, and reporting rules.
This distinction becomes especially important when comparing peptide COAs from different laboratories.
Two laboratories can analyze material originating from the same production batch and obtain different HPLC purity percentages without either laboratory intentionally producing a misleading result.
The key question is therefore not:
“Which laboratory reported the higher percentage?”
The better question is:
“How was each HPLC purity percentage generated?”
That is the question this article addresses.
After years of working with peptides and educating researchers, one of the most important lessons I have learned is that a COA should be interpreted as an analytical document, not as a single headline number.
Since 2003, my work in peptide supply and researcher education has involved reviewing third-party laboratory reports, examining COAs, communicating with laboratories, and helping researchers understand what analytical results actually tell them.
That experience has repeatedly reinforced one principle:
The methodology behind an HPLC purity percentage can be just as important as the percentage itself.
Why Two HPLC Reports Can Show Different Purity Percentages
There are several legitimate reasons two laboratories can report different HPLC purity percentages.
The most important include:
- Different HPLC columns
- Different mobile phases
- Different gradient programs
- Different flow rates and temperatures
- Different UV detection wavelengths
- Different sample preparation procedures
- Different peak integration parameters
- Different reporting thresholds
- Different treatment of unidentified peaks
- Actual changes in the sample between testing events
The difference may be small.
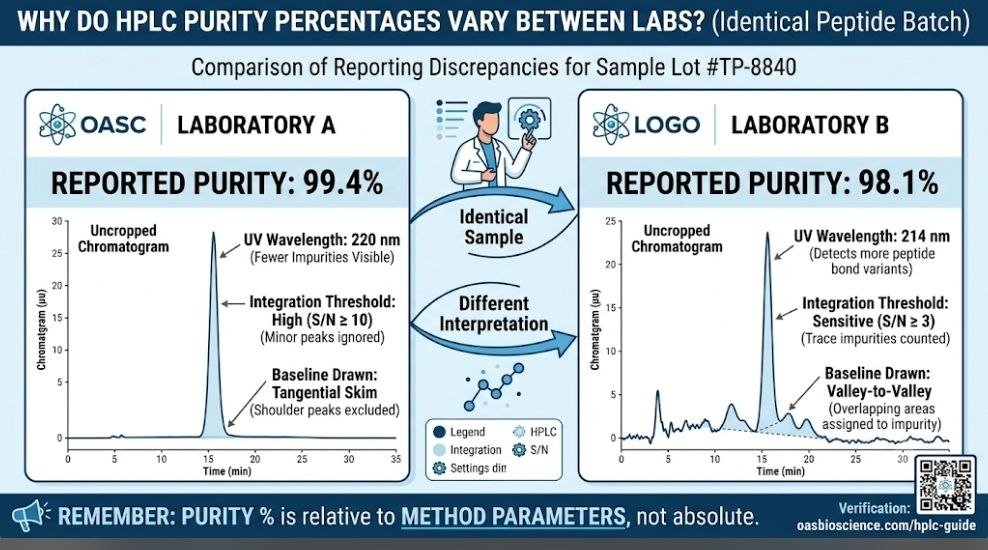
For example, one laboratory might report:
99.4%
while another reports:
98.1%
That does not automatically mean the peptide has deteriorated by 1.3%.
Likewise, a result of 99.6% is not automatically more trustworthy than 98.7%.
The laboratory method has to be examined first.
1. Different HPLC Columns Can Change the Result
One of the most important variables in reversed-phase HPLC is the chromatographic column.
Peptide analysis commonly uses reversed-phase columns, including C18-type stationary phases. However, two columns that are both described as C18 are not necessarily analytically identical.
They can differ in:
- Particle characteristics
- Pore size
- Column dimensions
- Surface chemistry
- Carbon loading
- End-capping
- Selectivity
- Manufacturer
- Column age
- Operating temperature
These differences can influence how closely related peptide molecules separate.
Imagine a peptide sample containing the desired peptide plus several closely related species.
Those impurities might include:
- Truncated sequences
- Oxidized species
- Deamidated species
- Isomeric forms
- Process-related impurities
- Other degradation products
If a particular column provides excellent separation between the principal peptide and a closely eluting impurity, the chromatogram may display two distinct peaks.
Another column may provide less separation.
Instead of seeing two clearly separated peaks, the second component might appear as a shoulder or partially overlap with the main peak.
That can influence peak integration and therefore the reported HPLC purity percentage.
This is why simply seeing “C18” on two COAs is not enough.
Researchers should ideally compare the complete column information.
2. Mobile Phase and Gradient Conditions Matter
The mobile phase is another major factor affecting an HPLC analysis.
Peptide HPLC methods may use combinations of aqueous and organic solvents, frequently involving water and an organic modifier such as acetonitrile or methanol, together with acidic or other mobile-phase additives appropriate to the method.
The gradient profile determines how the composition of the mobile phase changes throughout the run.
A shallow gradient and a steep gradient do not necessarily provide the same separation.
For example, imagine two laboratories analyzing the same peptide.
Laboratory A
Uses a relatively conventional gradient that rapidly brings the peptide off the column.
Laboratory B
Uses a shallower gradient designed to improve separation of closely eluting components.
Laboratory B may resolve several minor peaks that are difficult to distinguish in Laboratory A’s chromatogram.
Consequently, Laboratory B may report a lower HPLC purity percentage.
That does not necessarily mean Laboratory B tested inferior material.
It may mean that the analytical method had greater ability to resolve and quantify components that Laboratory A did not separate as effectively.
This is one reason method transparency matters when comparing COAs.
3. Detection Wavelength Can Affect HPLC Purity Percentage
UV detection wavelength is another important consideration.
Peptides have strong absorbance characteristics associated with their peptide bonds, and detection around 214 nm is commonly used for peptide analysis.
However, the correct wavelength depends on the analytical method and the substances being measured.
Different molecules do not necessarily have identical UV responses at different wavelengths.
Consequently, changing the detection wavelength can change the relative apparent size of chromatographic peaks.
This means that researchers should avoid an overly simplistic rule such as:
“214 nm is always correct and 280 nm is always wrong.”
That is not a scientifically defensible way to evaluate an analytical method.
Instead, ask:
What wavelength was used, why was it selected, and is the method appropriate for the peptide and impurities being evaluated?
For peptide characterization, the chromatogram should be interpreted within the context of the entire method.
4. Integration Parameters Can Change the Reported Purity
This is one of the most overlooked explanations for different HPLC purity percentages.
An HPLC instrument detects a signal.
The final purity number is produced after the chromatographic data are processed.
That processing involves identifying peaks and determining their areas.
Software used for chromatographic analysis can apply different integration parameters.
Examples include:
- Peak detection thresholds
- Minimum peak area
- Signal-to-noise criteria
- Baseline placement
- Peak splitting
- Peak grouping
- Integration windows
- Treatment of shoulders
- Treatment of unresolved peaks
Consider a chromatogram with a large primary peak and several extremely small peaks.
One processing method may classify only peaks above a particular reporting threshold as reportable impurities.
Another may integrate smaller peaks.
The total area assigned to impurities can therefore change.
Because chromatographic purity is generally expressed as a relative percentage of integrated areas within the defined calculation, the reported HPLC purity percentage can change as well.
Baseline placement is particularly important
Suppose a minor peak partially overlaps the tail of the primary peptide peak.
Where does the main peak end?
Where does the impurity begin?
Different validated integration approaches can assign different areas to the two components.
That is why the chromatogram itself matters.
A COA containing only:
Purity: 99.8%
does not provide the same amount of analytical information as a report containing:
- Full chromatogram
- Retention times
- Peak areas
- Relative area percentages
- Integration information
- Method details
- Sample identification
- Instrument information
The number is important.
The evidence behind the number is more important.
5. Sample Preparation Can Produce Different Results
The laboratory does not analyze an abstract concept called “the peptide.”
It analyzes a specific prepared sample.
Sample preparation can therefore influence the result.
Relevant variables can include:
- Sample concentration
- Solvent
- Dilution
- Mixing
- Filtration
- Reconstitution conditions
- Time between preparation and injection
- Temperature
- Exposure to light
- Exposure to oxygen
- Storage conditions before testing
Peptides can be sensitive to environmental conditions, depending on their sequence and chemical structure.
Some sequences are more vulnerable to processes such as oxidation, deamidation, aggregation, or other forms of degradation.
For example, a sample analyzed immediately after preparation may not necessarily produce an identical chromatographic profile to material that experienced unfavorable storage or handling conditions before testing.
This is particularly relevant when two laboratories test samples at different times.
If the sample itself has changed, the difference is no longer merely a difference in analytical methodology.
It may represent a genuine chemical difference between the samples at the time of analysis.
6. Different Reporting Criteria Can Produce Different Numbers
Two laboratories may observe similar chromatographic information but use different reporting conventions.
For example, one laboratory may report a broader collection of minor peaks.
Another may apply a defined reporting threshold and exclude components below that threshold from the reported impurity calculation.
This distinction can become significant when a sample contains many trace-level components.
Researchers should therefore ask:
What exactly does this laboratory mean by “purity”?
Does the laboratory mean:
- Main peak area percentage?
- Sum of specified chromatographic components?
- Area normalization?
- A validated purity calculation?
- Another laboratory-defined metric?
These terms should not automatically be treated as interchangeable.
This is particularly important when comparing reports from different analytical facilities.
7. The Peptide May Actually Have Changed
Not every difference is caused by laboratory methodology.
Sometimes the material really has changed.
A peptide can potentially undergo chemical or physical changes during:
- Storage
- Shipping
- Temperature excursions
- Repeated freeze-thaw cycles
- Exposure to moisture
- Exposure to oxygen
- Improper handling
- Extended time after reconstitution
For that reason, researchers should compare:
Sample identity + lot number + testing date + storage history + analytical method.
If the same lot was tested six months apart under significantly different conditions, the results cannot automatically be treated as though they represent exactly the same analytical state.
HPLC Purity Percentage vs. Actual Peptide Content
This is perhaps the most important distinction in the entire subject.
HPLC purity percentage is not the same thing as the amount of peptide present.
Suppose a vial contains material described as approximately 10 mg.
An HPLC report could show:
99% chromatographic purity
That tells you something about the chromatographic profile of the analyzed material.
It does not, by itself, establish that the vial contains exactly 10 mg of the target peptide.
Why?
Because a lyophilized peptide preparation can contain components other than the target peptide itself.
Depending on how the material is produced and characterized, these may include:
- Residual moisture
- Counterions or salt components
- Residual solvents
- Other non-chromophoric components
- Process-related material
A chromatographic area percentage is therefore not automatically equivalent to a gravimetric mass percentage.
A simple example
Imagine two materials:
Sample A
- Total recovered material: 10 mg
- HPLC area purity: 99%
Sample B
- Total recovered material: 7 mg
- HPLC area purity: 99%
Both could theoretically have the same chromatographic purity while containing different total amounts of material.
That is why purity, assay/content, and identity are separate analytical questions.
A strong analytical package should not rely on one number to answer every question.
A Practical COA Comparison Checklist
When comparing two HPLC reports, I recommend working through the following questions.
1. Does the batch number match?
Check:
- Lot number
- Batch number
- Sample identification
- Product name
- Testing date
If the identifiers do not match, you may not be comparing the same material.
2. Is the HPLC method disclosed?
Look for:
- Column
- Dimensions
- Stationary phase
- Mobile phase
- Gradient
- Flow rate
- Temperature
- Detection wavelength
- Injection volume
- Run time
The more transparent the method, the easier it becomes to interpret the result.
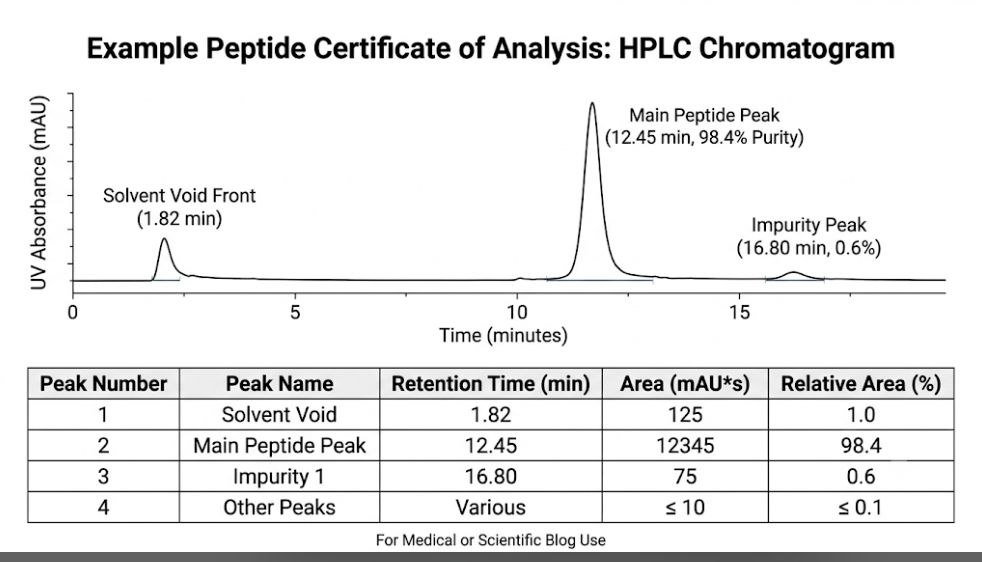
3. Is the full chromatogram available?
A full chromatogram is much more informative than a large purity number printed in a table.
Look for:
- Main peak
- Retention time
- Minor peaks
- Shoulders
- Baseline behavior
- Early solvent/system peaks
- Late-eluting peaks
- Integration markers
A tightly cropped chromatogram may not show the entire analytical picture.
4. Is an integration table included?
Ideally, you should be able to see the principal peaks and their relative areas.
This helps answer:
“Where did the reported purity percentage actually come from?”
5. Is the reporting method explained?
Ask whether the laboratory reports:
- Area normalization
- Reportable impurities
- Specified impurities
- Unspecified impurities
- Total impurities
- Main peak percentage
Without knowing the calculation approach, two percentages may not be directly comparable.
6. Is peptide identity tested separately?
HPLC primarily provides chromatographic information.
A complementary analytical technique such as mass spectrometry (MS) can provide valuable information about molecular mass and identity.
These tests answer different questions.
A strong COA should not be interpreted as though one test proves everything about a peptide.
7. Is quantity/content reported separately?
Where relevant, look for an assay or content measurement.
Ask:
“How much material is actually present?”
Then ask:
“How chromatographically pure is that material?”
Those are different questions.
Two Illustrative Peptide HPLC Case Studies
The following examples demonstrate how two reports can legitimately differ. They are illustrative analytical scenarios, not presented as original laboratory records.
Case Study 1: Tirzepatide
Imagine a single production batch of lyophilized tirzepatide being submitted to two independent laboratories.
Laboratory A
- HPLC purity: 99.4%
- Main peak retention time: 12.42 minutes
- One minor reported peak
Laboratory B
- HPLC purity: 98.1%
- Main peak retention time: 11.85 minutes
- Several minor peaks detected
At first glance, Laboratory A appears to have produced the “better” result.
But that conclusion is premature.
Suppose Laboratory A and Laboratory B used different columns and gradient conditions.
Laboratory B’s method may have provided better separation of closely eluting components.
If Laboratory B resolved additional minor peaks that Laboratory A did not clearly separate, its lower HPLC purity percentage could actually reflect greater chromatographic resolution, rather than inferior material.
This is exactly why comparing only the headline number can be misleading.
Case Study 2: Semaglutide
Consider another illustrative example involving semaglutide.
Laboratory A
- HPLC purity: 98.9%
- Detection: 214 nm
Laboratory B
- HPLC purity: 99.6%
- Detection: another wavelength
The tempting conclusion is:
“Laboratory B found a purer sample.”
But the correct interpretation requires more information.
Were the columns identical?
Were the gradients identical?
Were the samples prepared identically?
Were the laboratories using the same integration rules?
Were the samples tested on the same day?
Was moisture measured?
Were the same impurity classes included in the purity calculation?
Without those answers, comparing 98.9% with 99.6% as though they were interchangeable measurements is scientifically weak.
The correct approach is to compare the analytical methods first and the percentages second.
How Experienced Researchers Should Read an HPLC Report
A useful way to read an HPLC COA is to move from the broadest question to the most specific.
Step 1: What material was tested?
Confirm the product, lot, batch and sample identity.
Step 2: What exactly was measured?
Determine whether the reported number represents HPLC area purity, assay, content, or another measurement.
Step 3: How was it measured?
Review the HPLC method.
Step 4: What does the chromatogram show?
Look at the actual trace rather than relying solely on the summary table.
Step 5: How were peaks integrated?
Review the integration table and reporting criteria when available.
Step 6: Are complementary tests available?
Consider identity and other quality attributes separately.
This approach transforms COA interpretation from number chasing into analytical evaluation.
Common Mistakes When Comparing HPLC Reports
Mistake 1: Automatically choosing the highest percentage
A 99.8% result is not automatically better evidence than a 98.9% result.
The method matters.
Mistake 2: Assuming every C18 method is identical
C18 describes a broad class of stationary phases.
Different columns can have different selectivity and performance.
Mistake 3: Treating HPLC purity as mass purity
Area percentage is not automatically equivalent to weight percentage.
This distinction is fundamental.
Mistake 4: Ignoring the chromatogram
A purity number without supporting chromatographic information gives you much less context.
Mistake 5: Ignoring the testing date
If two samples were tested months apart, sample history becomes relevant.
Mistake 6: Assuming different results mean one laboratory made an error
Different analytical methods can legitimately produce different results.
The reports need to be compared methodologically before assigning blame.
Mistake 7: Assuming more decimals mean more accuracy
A report showing:
99.47%
does not necessarily provide more scientifically meaningful information than:
99.5%
The quality of the analytical method and measurement system matters more than cosmetic numerical precision.
What a Strong Peptide COA Should Show
When reviewing peptide COAs, I look for traceability and analytical transparency, not merely an impressive purity number.
Useful information includes:
Sample identification
- Product name
- Batch/lot number
- Sample identifier
- Testing date
HPLC information
- Column type
- Column dimensions
- Mobile phase
- Gradient
- Flow rate
- Detection wavelength
- Injection conditions
- Run time
- Retention time
Chromatographic evidence
- Full chromatogram
- Main peak
- Minor peaks
- Integration information
- Peak areas
- Relative percentages
Complementary characterization
Where appropriate:
- Mass spectrometry
- Assay/content
- Moisture
- Residual solvents
- Other relevant quality tests
No single analytical result should be treated as though it answers every possible quality question.
Why Third-Party Testing Can Be Valuable
Independent testing can provide useful external evidence when evaluating a peptide sample.
Laboratories such as Janoshik, MZ Biolabs, Vanguard Laboratory, ILS Laboratories, and other analytical providers may use different analytical workflows and reporting formats.
That does not mean one laboratory should automatically be considered superior simply because its reported percentage is higher.
The important questions remain:
What method was used?
Was the sample properly identified?
Is the report traceable?
Is the chromatogram available?
Are the analytical parameters disclosed?
Are complementary tests available?
When reviewing third-party COAs, I encourage researchers to evaluate the quality of the evidence, not simply the size of the number.
What I Have Learned From Years of Peptide COA Review
My experience supplying and educating researchers since 2003 has taught me that one of the biggest problems in peptide purchasing is not necessarily the absence of laboratory testing.
It is misinterpretation of laboratory testing.
Researchers often receive a COA and immediately look for one thing:
Purity: 99%
But an experienced COA review goes much deeper.
I want to know:
- What sample was tested?
- Which batch did it come from?
- Which laboratory tested it?
- Which analytical method was used?
- Which column was used?
- Which wavelength was used?
- What does the chromatogram actually show?
- How were peaks integrated?
- What other tests were performed?
- Does the reported quantity agree with the stated product specification?
- Can the report be independently verified?
Working with researchers over many years has reinforced the importance of teaching people how to interpret evidence, rather than simply telling them what number to trust.
That is also why transparent documentation is important for peptide suppliers.
At OasBioScience, our goal is to help researchers understand what analytical documentation means rather than asking them to blindly trust a percentage printed on a page.
For additional information about our research-use peptide products and available documentation, visit oasbioscience.com.
The Most Important Rule When Comparing HPLC Purity Percentages
If you remember only one thing from this article, remember this:
Never compare two HPLC purity percentages without first comparing the methods that produced them.
A difference between:
98.2% and 99.4%
does not automatically mean a difference in actual material quality of exactly 1.2 percentage points.
The numbers may have been produced using different:
- Columns
- Gradients
- Mobile phases
- Detection wavelengths
- Temperatures
- Sample preparations
- Integration parameters
- Reporting thresholds
The material may also have changed between testing events.
Therefore, the correct comparison is:
Method → chromatogram → integration → sample identity → complementary testing → reported percentage
rather than:
99.4% > 98.2% = better
That second approach is far too simplistic.
Continue Learning: If you found this guide helpful, you may also want to read our previous peptide education articles covering the following topics
• Does adding more diluent make peptides weaker?
• Peptide vendor documents explained
• Explore 9 evidence-based facts about BPC-157
• How long should a weight loss cycle last?
• Can GLP-1 muscle loss be prevented?
• Discover the best peptide for obesity research.
• Which peptide suppresses appetite the most?
• Discover 9 powerful fixes for peptide foaming
• Learn how to read peptide Certificates of Analysis step by step.
• How Should Peptides Be Stored?
• Learn the correct peptide reconstitution process 2026
Scientific Reference: For additional peer-reviewed information on peptide stability, sterile preparation, and pharmaceutical reconstitution practices, visit
European Medicines Agency (EMA)
National Center for Biotechnology Information (NCBI)
Frequently Asked Questions
1. Why do two HPLC reports show different purity percentages?
Two HPLC reports can show different purity percentages because the laboratories may use different columns, mobile phases, gradients, temperatures, detection wavelengths, sample preparation procedures, integration parameters, or reporting criteria.
The samples may also have changed between testing dates.
A difference does not automatically mean one laboratory is wrong.
2. Which HPLC purity percentage should I trust?
Do not choose a report solely because it has the highest percentage.
Instead, evaluate the analytical method, chromatogram, integration information, sample identity, testing date, laboratory traceability, and complementary analytical results.
A lower percentage supported by transparent methodology can provide more useful evidence than a higher percentage with little supporting information.
3. Is 99% HPLC purity the same as 99% peptide content?
No.
HPLC area purity and peptide content are different measurements.
An HPLC purity percentage generally describes the relative chromatographic composition under the specified analytical method. It does not automatically establish the absolute mass of target peptide in a vial.
Assay/content, moisture and other measurements may be needed to understand the total material more completely.
4. Can the same peptide have different HPLC purity percentages at different laboratories?
Yes.
If laboratories use different analytical methods, the reported HPLC purity percentage can differ.
Differences in column selectivity, gradient conditions, detection wavelength, sample preparation and peak integration can all contribute.
This is why two COAs should be compared by methodology rather than by headline percentage alone.
5. Does a higher HPLC purity percentage always mean a better peptide?
No.
A higher reported HPLC purity percentage is not automatically proof of superior overall product quality.
Researchers should consider identity, chromatographic purity, content/assay and other relevant quality characteristics separately.
6. Does the HPLC column affect peptide purity results?
Yes.
Different columns can have different selectivity and separation characteristics, even when they belong to the same general column class.
This can influence the separation of closely related peptide impurities and consequently affect the reported HPLC purity percentage.
7. Can peak integration change an HPLC purity percentage?
Yes.
Peak integration determines how chromatographic signal is assigned to individual components.
Baseline placement, peak detection thresholds, integration windows and treatment of overlapping peaks can influence calculated relative areas.
The integration procedure should therefore be appropriate, documented and consistent with the analytical method.
8. Is 214 nm always the correct wavelength for peptide HPLC?
Not necessarily.
Detection around 214 nm is widely used for peptide analysis because peptide bonds absorb strongly in this region, but the appropriate detection wavelength depends on the analytical method and the substances being evaluated.
The scientifically useful question is whether the selected wavelength is appropriate and justified for the method.
9. Should researchers compare only the purity number on a COA?
No.
Researchers should examine the entire analytical package where available.
Important information includes the batch number, testing date, laboratory, HPLC method, chromatogram, integration data, identity testing and relevant assay/content information.
The purity number is one part of the evidence.
10. What should I check first when two peptide COAs disagree?
Start with the batch/lot number and analytical methodology.
Then compare:
- Column
- Mobile phase
- Gradient
- Detection wavelength
- Flow rate
- Temperature
- Run time
- Sample preparation
- Integration criteria
- Chromatogram and peak table
Only after these factors have been compared should you interpret the difference in reported purity.
Final Takeaway
HPLC purity percentage is valuable, but it should never be treated as a standalone measure of total peptide quality.
Two laboratories can analyze material originating from the same batch and report different percentages because analytical chemistry involves both the sample and the method used to measure it.
Column chemistry matters.
Mobile phase matters.
Gradient conditions matter.
Detection wavelength matters.
Sample preparation matters.
Peak integration matters.
Reporting criteria matter.
And, importantly, the sample itself can change.
The biggest mistake a researcher can make is looking at two COAs and assuming that the higher number automatically wins.
Instead, ask:
“What analytical process produced this number?”
That question leads to a much more meaningful evaluation.
After years of peptide supply, researcher education and third-party COA review, this remains one of the most important lessons I can share:
Don’t buy the number. Understand the measurement.
For researchers evaluating peptide documentation, a transparent COA with traceable sample identification, appropriate methodology, chromatographic evidence and complementary characterization is far more informative than a large purity percentage printed without supporting details.
HPLC purity percentage is a measurement—not a complete definition of product quality.
Research-use note: Analytical results should be interpreted according to the applicable laboratory method and intended research application. Research-use materials are not intended to diagnose, treat, cure, or prevent disease in humans or animals.

